Showing posts with label Excel. Show all posts
Showing posts with label Excel. Show all posts
11.22.2011
Birthdays of the month, tally marks n' Excel graphs- 2nd-4th Grade
As a mini-checkpoint assessment for Excel, the Second-Fourth Graders collected data using tally marks, converted the tally marks to numbers, layed out the data on an Excel spreadsheet and created a bar graph. The data that we collected was a count of birthdays for each month of our classmates and family members. I kept track of the count using tally marks on the white board as the students dug deep into their minds to remember when their classmates' and family members' birthdays were. Once all of the data was collected, the students took turns converting the tally marks to numbers. Then, with very little help from me, they were instructed create the spreadsheet and graph. There were a handful of students who remembered all of the steps, and they proudly reminded the others who had forgotten. It was a triumph for those who remembered and a good review for those who forgot!

11.02.2011
Favorite Ice Cream- 3rd & 4th Grade
The Third and Fourth Graders created a spreadsheet and graph using "favorite ice cream flavors" as their topic. They learned some new skills including hiding rows in an Excel spreadsheet and using the "PrtScn" key to copy & paste an image of the screen to Paint. Below are the images that they generated using the PrtScn key.


10.11.2011
Excel Introduction- 2nd Grade
 The Second Graders were introduced to a new Microsoft Office application, Excel. They learned the following vocabulary words: cells, rows, columns, graph, and spreadsheet, selected mulitiple and single cells using their mouse and arrow keys and selected entire rows and columns. On Thursday they will follow up the lesson with a simple spreadsheet and graph. After they have completed a couple charts, the Second Graders will do the colored candy project! This project is a special treat for all of the Second Graders, year after year.
5.17.2011
Favorite Seasons- 2nd Grade
The Second Graders made suggestions for projects to go along with their Science theme, seasons. The students suggested creating a fact sheet using word, a slide show using PowerPoint and a graph using Excel. The kids voted, and the graph with Excel project won the majority!
The students rated each season, one being their least favorite and four being their favorite. I recorded all of the data, and the students worked together to add the numbers. The students typed the total data into the spreadsheet. Then, they showed me how to create a pie chart using the data. I was delighted to see that everyone was able to create a chart!
The kids formatted the chart color and font style, and they added a title. Then, they saved their work to the server. Good job Second Grade!
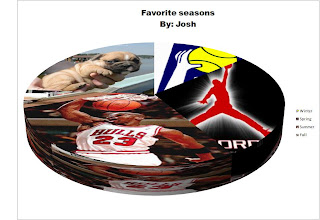


The students rated each season, one being their least favorite and four being their favorite. I recorded all of the data, and the students worked together to add the numbers. The students typed the total data into the spreadsheet. Then, they showed me how to create a pie chart using the data. I was delighted to see that everyone was able to create a chart!
The kids formatted the chart color and font style, and they added a title. Then, they saved their work to the server. Good job Second Grade!


5.02.2011
Graphing Coins on Excel- 2nd-6th Grade
I was inspired by a coin collection that a student shared with me last week. I wanted to help him find some of the coins that he needed to add to his collection. Knowing that I had a huge collection of coins in my house that had been sitting around for at least the last decade, I thought I could find some of the coins he was looking for.
This small idea turned into a very exciting idea for Monday's computer class project. In the end, I decided to have the kids make a "guess-estimate" of the total money that was in my coin collection. The students recorded their guesses on the Excel spreadsheet. Next, the students typed labels (pennies, nickles, dimes, and quarters) into the cells of the A column. Then, they each took a handful of coins, and they sorted the coins into groups, counted how many coins were in each group, and recorded their data into the appropriate cells in the B column. They used the "auto sum" tool to add up the total number of coins that they had in their handful. I recorded their data into my own spreadsheet. I showed the kids how to use formulas (ex: =B4*5 for nickels) to find the value of each group. I also showed the kids how to divide the total amount by 100 to convert the total number of cents into dollars and cents.
The best part of this project is that the students will research different charities, and they will vote on one charity to be a recipient of the grand total as a donation! The grand total was $98.12!

This small idea turned into a very exciting idea for Monday's computer class project. In the end, I decided to have the kids make a "guess-estimate" of the total money that was in my coin collection. The students recorded their guesses on the Excel spreadsheet. Next, the students typed labels (pennies, nickles, dimes, and quarters) into the cells of the A column. Then, they each took a handful of coins, and they sorted the coins into groups, counted how many coins were in each group, and recorded their data into the appropriate cells in the B column. They used the "auto sum" tool to add up the total number of coins that they had in their handful. I recorded their data into my own spreadsheet. I showed the kids how to use formulas (ex: =B4*5 for nickels) to find the value of each group. I also showed the kids how to divide the total amount by 100 to convert the total number of cents into dollars and cents.
The best part of this project is that the students will research different charities, and they will vote on one charity to be a recipient of the grand total as a donation! The grand total was $98.12!

4.08.2011


4.05.2011
Mock Church Budget Spreadsheet on Excel- 3rd-6th Grade
The Third-Sixth Graders are working on a mock church budget spreadsheet on MS Excel. They are using various tools such as merge & center, text color, auto-sum and auto difference, and general cell formatting. We reviewed some budget vocabulary words including income, salary, expense, consumables, utilities, donations, offerings, misc. and savings.


3.17.2011
Graphing Colored Candy- 2nd Grade
 Creating a graph using the colors of candy pieces has sort of become a rite of passage for our Second Graders at ZSJ. The kids just LOVE this project! Today the students received their bag of Skittles or M&Ms, sorted the candy pieces by color and typed the information in a spread sheet. After they had sorted and counted the candy, they were free to enjoy the candy. Tomorrow they will show me that they know how to use the information on the spread sheet to create a graph!
1.24.2011


1.14.2011
Pet Graph on MS Excel- 2nd Grade
The Second Graders continue their introduction to MS Excel with a mini project of graphing the number of pets that they have. On Friday, the students typed the labels into the appropriate cells. On Monday they will use the "auto sum" tool and create a graph. I think they'll enjoy experiementing with the various formatting features that MS Excel 2007 has to offer. The students will print their completed graphs and put them on display!
12.14.2010
Christmas Wish List- 3rd-5th Grade
The Third-Fifth Graders are using Microsoft Excel to create a wish list spreadsheet. The students used specific tools to set up the spreadsheet, including "merge & center," "bottom boarder," and "$-accounting number format." They reviewed Excel vocabulary including row, column and cell. They also practiced skills such as widening columns, resizing and arranging the windows on the desktop and inputting data.
Subscribe to:
Posts (Atom)